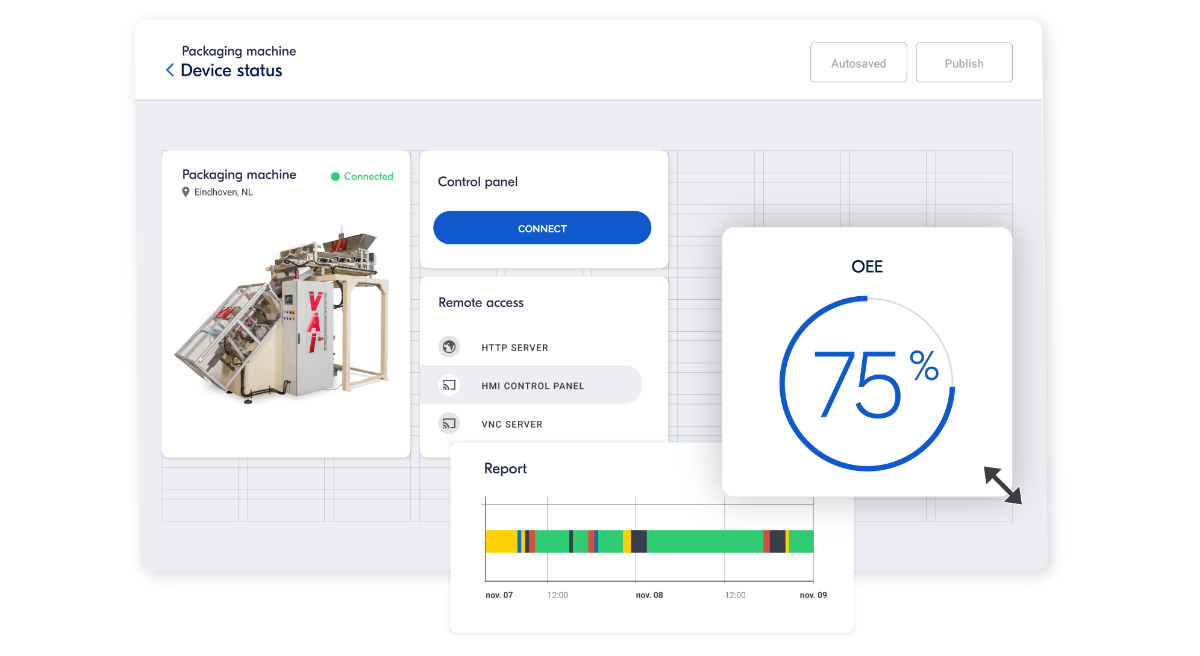

All-in-one page builder for industrial interfaces
Drag & drop your way to a powerful portal with IXON’s pre-built widgets in the component library. Resize and reposition them with intuitive drag & drop functionality. Create pages for live or historical data, all without writing code. Need advanced functionality? Use the IXON Component SDK to create your own widgets or embed third-party applications.
Learn more about the Component SDK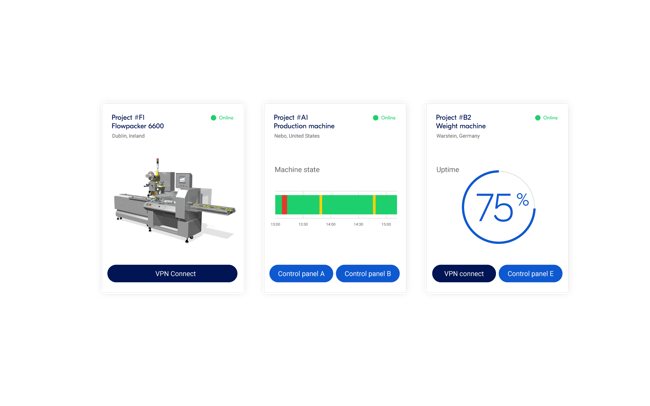
Customize your portal to fit any use case
- Use list, map or card views to display connected devices. Customize what’s shown in each card, like a VPN button, location or KPIs.
- Create dashboards tailored to different business cases, for example a performance dashboard with downtime and cycle time.
- Save templates and roll out consistent dashboards across your machine portfolio to prevent repeating work.
.png?width=550&height=443&name=White-labelling%20(1).png)
Turn your platform into a branded service
Offer your own branded service portal without having to build one from scratch and strengthen customer loyalty. White labelling options:
- Custom logo, colors and domain
- Personalized login screens and Terms of Use
- Your own mobile app in the app stores
“The rapid implementation was decisive. In less than two months we had our own app and branding up and running.”